Emma Clinton's Portfolio
Collection of Open Source GIScience Projects
Project maintained by emmaclinton Hosted on GitHub Pages — Theme by mattgraham
RE- Spatial-temporal and content analysis of Twitter Data
Replication of
Spatial, temporal and content analysis of Twitter data
Original study by Wang, Z., X. Ye, and M. H. Tsou. 2016. Spatial, temporal, and content analysis of Twitter for wildfire hazards. Natural Hazards 83 (1):523–540. DOI:10.1007/s11069-016-2329-6. and First replication study by Holler, J. 2021 (in preparation). Hurricane Dorian vs Sharpie Pen: an empirical test of social amplification of risk on social media.
Replication Author: Emma Clinton
Replication Materials Available at: emmaclinton.github.io
Created: 05 May 2021
Revised: 25 May 2021
Abstract
Why study the spatial distribution of Twitter data?
Wang et al (2016) analyzed Twitter data for wildfires in California, finding that the social media data coupled spatially and temporally with wildfire activity. They also found that spatial information and information about fire-related damage and responses are frequently communicated during such events. Interestingly, there was strong separation between hubs of retweet activity (i.e. users who are frequently retweeted, such as media or authority figures) and less popular users, with only hubs being consistently retweeted and other users not being retweeted nor retweeting other users who are not frequently retweeted.
Holler (2021) is studying Twitter data for Hurricane Dorian on the Atlantic coast, finding that in spite of tending news and social media content regarding a false narrative of risk, original Tweets still clustered significantly along the real hurricane track, and only along the hurricane track.
Reproducing and replicating spatial research of data regarding the social media implications of natural disasters continues to be relevant for many reasons. There are many ethical considerations regarding the sharing of private information and access to disaster data. This data also has potential for high utility regarding designing response networks in future disaster scenarios and getting help to those on the ground in future scenarios.
In this replication study, I will analyze Twitter activity data regarding a recent tornado outbreak using data from April 26, 2021 - May 04, 2021 in Georgia and several surrounding states to see how this severe storm influenced people’s social media activity.
Original Study Information
The original study by Wang et al (2016) used the Twitter Search API using a two-phase search for data collection. The first phase involved searching for “fire” or “wildfire” in Tweets, while the second phase pulled out fire-related tweets associated with specific locations (i.e. associated with specific wildfires). Data mining was done using the tm package in R and data was cleaned by removing URLs and stop words. Wang et al. (2016) used kernel density estimation to determine hot spots of Twitter activity, normalized by population data. K-means clustering was used to determine which terms most frequently appeared together. This analysis found that there was strong spatial and temporal coupling of wildfire activity and Twitter activity, and that spatial coupling strengthened when Twitter data were normalized by population. It is not known what GIS platform was used to carry out this spatial analysis.
Wang et al. (2016) also conducted a social network analysis to determine which users were “hubs” of information and were frequently retweeted and retweeted mainly only other large hubs of information. This process required the igraph package in R. A social network analysis was built from this retweet information showing how information diffuses through a network. The findings of this analysis indicate that there exists strong separation between hubs of retweet activity (i.e. users who are frequently retweeted, such as media or authority figures) and less popular users, with only hubs being consistently retweeted and other users not being retweeted nor retweeting other users who are not frequently retweeted.
Holler (2021) loosely replicated the methods of Wang et al (2016) for the case of Hurricane Dorian’s landfall on the U.S. mainland during the 2019 Atlantic Hurricane season.
Holler modified Wang et al’s methods by not searching for retweets for network analysis, focusing instead on original Tweet content with keywords hurricane, Dorian, or sharpiegate (a trending hashtag referring to the storm). Holler modified the methodology for normalizing tweet data by creating a Normalized Tweet Difference Index (NTDI) and extended the methodology to test for spatial clustering with the local Getis-Ord statistic. The study tested a hypothesis that false narratives of hurricane risk promulgated at the highest levels of the United States government would significantly distort the geographic distribution of Twitter activity related to the hurricane and its impacts, finding that original Twitter data still clustered only in the affected areas of the Atlantic coast in spite of false narratives about risk of a westward track through Alabama.
The replication study by Holler (2021) used R, including the rtweet, rehydratoR, igraph, sf, and spdep packages for analysis.
Materials and Procedure
The script needed to replicate the data search is included here. This research searched for tweets from the week leading up to May 04, 2021 within 3,000 mi of Atlanta, GA, where a tornado watch was issued. The keywords included in this search were “tornado”, “warning”, “shelter”, and “storm.” Baseline data on Twitter activity to compare with the tornado tweets and to create the Normalized Tweet Difference Index (NTDI) as per Holler (2021) were also generated. The search for this baseline data was essentially the inverse of the search for the tornado data and excluded all tweets that contained the above keywords.
Tornado tweet ids for rehydration
Baseline tweet ids for rehydration
This script contains the procedure for several analyses run on these tweets. First, tweets were analyzed temporally to determine when tornado-related activity was high. The script also details how the tweet contents were graphed to see which terms occurred most frequently, and they were also mapped and compared to population density data from the US Census.
In this script, the NTDI (Holler, 2021) was created by comparing the tornado tweets to the baseline tweets using the formula NTDI = (tornado - base) / (tornado + base). A spatial cluster analysis using the G statistic was also implemented to reveal areas where Twitter activity differed significantly from the norm during the temporal duration of the tornado warning. The null hypothesis for this statistic states that there is no spatial clustering of the input features, and when clustering is found to be significantly high or low, this null hypothesis is rejected. These results were then mapped (Fig. 4).
Replication Results
The temporal analysis of tweet activity in the region yielded the results shown in Fig. 1. There was clearly an increase in tornado-related Twitter activity around May 4.
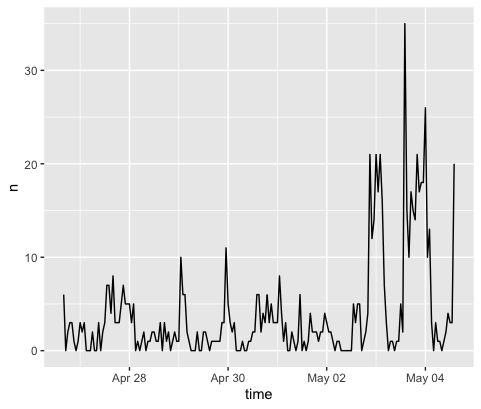
Fig. 1. Temporal analysis.
The content analysis graph shown in Fig. 2 counts the instances of unique words found in tweets, and it is clear that “watch,” which was not included as a keyword in this analysis, showed up frequently in tornado-related tweets. Word associations (not shown here) were mostly related to dates, times, and time zones of watch or warning issues.
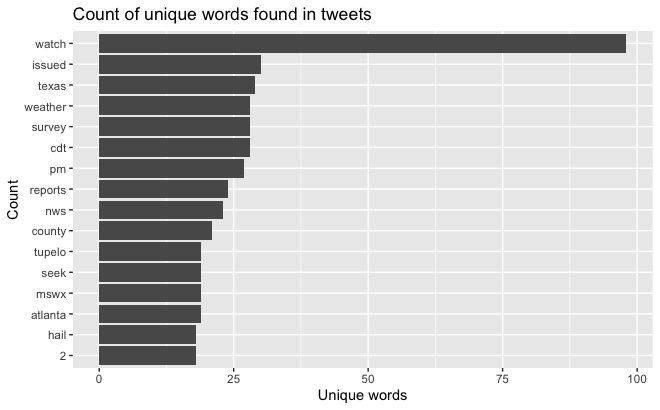
Fig. 2. Tweet content analysis.
The map of twitter activity in Fig. 3 is shown in comparison to county population data.
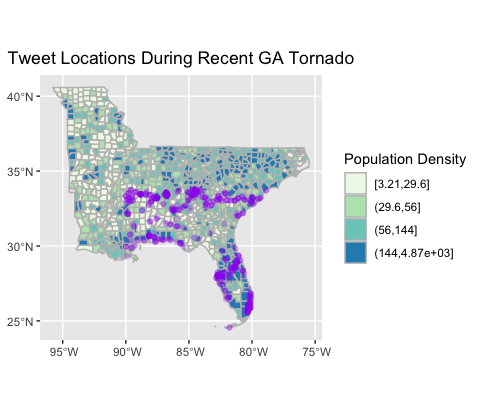
Fig. 3. Map of tornado-related Twitter activity.
Finally, Fig. 4 shows the cluster hotspot analysis to show where there was significant deviation from baseline Twitter data.
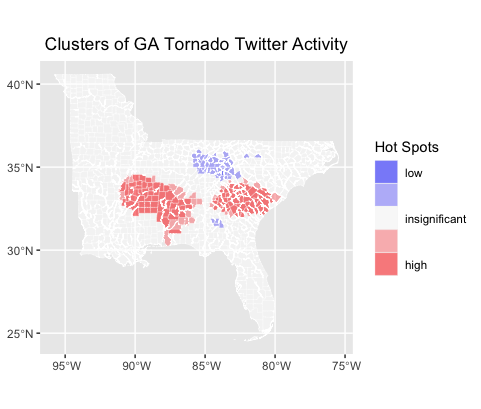
Fig. 4. Cluster hotspot analysis.
Unplanned Deviations from the Protocol
There is certainly room for uncertainty in the selection of keywords in this analysis. In addition, the fact that not all tweets (in fact, the majority of tweets) are not geotagged means that much information is left out in this analysis (roughly 700 tweets had spatial information associated with them, compared to several thousand tweets that contained the search keywords). Wang et al. (2016) also did not include information about the GIS platform that they used in their kernel density analysis, meaning that it is likely that this analysis differs from the original study.
Additionally, it was necessary to remove some tweets that were on the outer edge of the 3000mi search radius, as there were very few of them and they threw off the scale of the analysis.
Discussion
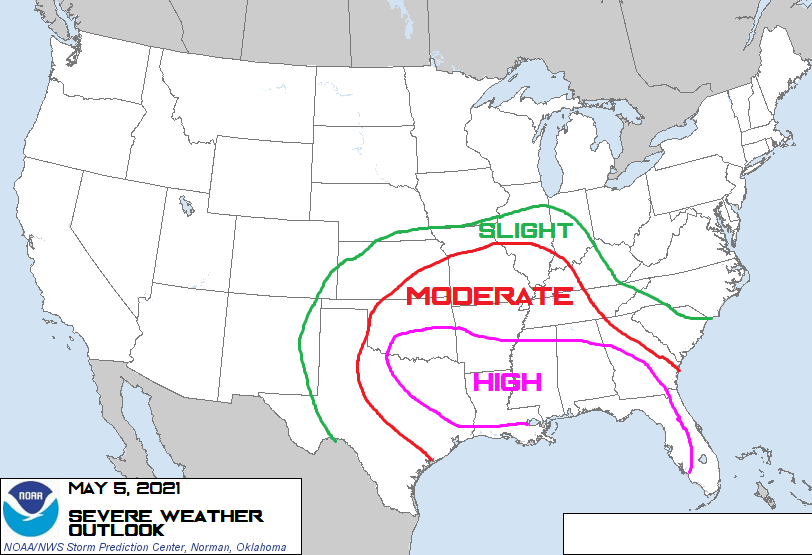
Fig. 5. NOAA Tornado Warning (May 05).
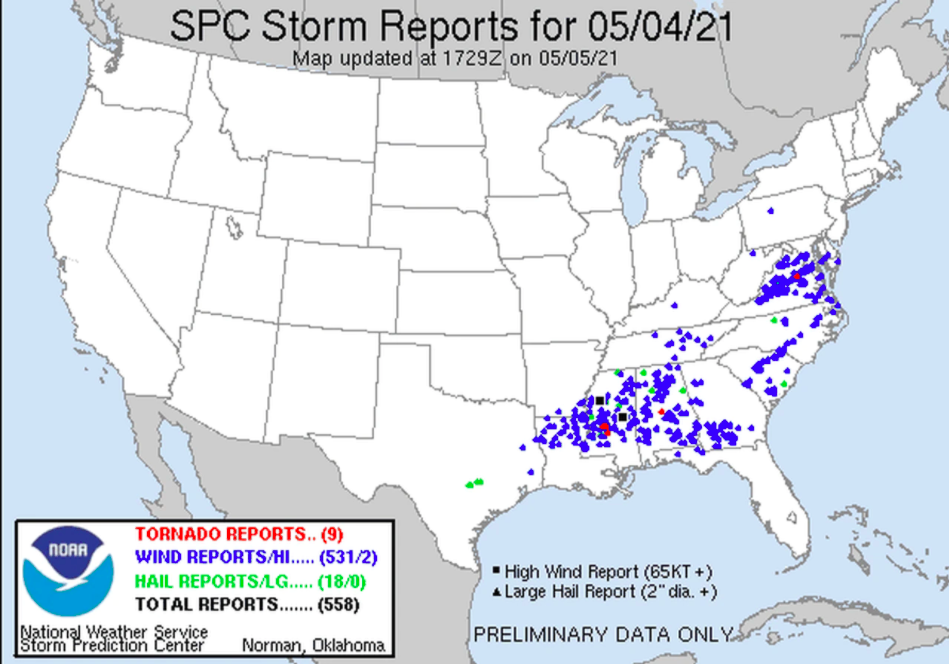
Fig. 5. NOAA Tornado and Storm Location Points (May 05).
When comparing Fig 3 and Fig. 4 with Fig. 5 and Fig. 6, it does appear that a great deal of Twitter activity paralleled the tornado tracks. These storms were severe and caused widespread damage, and many southern states were warned to be on alert for tornadoes on May 3-5, 2021. In some areas, storm activity resulted in significant property damage, several deaths, and extensive power outages (Victor and Jimenez, 2021). These storms generally moved eastwards, and it appears that the areas of the country that have the highest significant clustering of activity are located within the moderate- to high-risk areas of the American south. (Fig. 4, Fig. 5, Fig. 6).
It is interesting to consider the twitter activity in Florida shown in Fig. 3. There were warnings of severe weather in Florida, but the tornadoes never actually made landfall, and as Fig. 4 shows, the Twitter activity was not significantly different from the baseline. Perhaps the fact that the tornadoes did not make landfall here made for a less significant spike in tornado related Twitter activity than in areas where tornadoes actually occurred.
Power outages are important to consider in the context of Twitter analyses, because outages may mean that individuals who are impacted are unable to share information about their status or the situation evolving around them, leading to an incomplete picture of a disaster scenario (Crawford and Finn, 2014). It is also important to consider the human implications of such events when mapping natural disasters. There is a tendency to dissociate data like these from the humans that produced them, especially when data are made anonymous and aggregate. However, it is essential to recognize the devastating impacts of such events and realize that the repercussions of events like tornadoes and severe storms extend far beyond the temporal bounds of the storm event itself.
These findings seem to confirm the findings of Wang et al. (2016) in that the areas that experienced tornado warning or damage were found to have high cluster density of tornado-related Twitter activity. These results also track well with the findings of Holler (2021) in that the Twitter activity largely tracks the eastward movement of this storm event and its impacts, similar to the activity correlating with the movement of Hurricane Dorian.
Conclusion
Similar to Wang et al. (2016) and Holler (2021), this replication analysis shows that Twitter activity during natural disasters spatially and temporally tracks the development and anticipation of the physical event itself. However, it is still necessary to acknowledge that there is a lack of spatial information in much Twitter data, leading to an incomplete picture of social media activity during such events. It would be interesting to analyze areas impacted by power outages to see how Twitter activity tracks in places that may not have had access to service during these storm events.
References
Crawford, K., and M. Finn. 2014. The limits of crisis data: analytical and ethical challenges of using social and mobile data to understand disasters. GeoJournal 80 (4):491–502. DOI:10.1007/s10708-014-9597-z
Victor, D., & Jimenez, J. (2021, May 04). Severe weather continues in south for third straight day. The New York Times. https://www.nytimes.com/2021/05/04/us/tornado-storm-south.html
Wang, Z., X. Ye, and M. H. Tsou. 2016. Spatial, temporal, and content analysis of Twitter for wildfire hazards. Natural Hazards 83 (1):523–540. DOI:10.1007/s11069-016-2329-6
Report Template References & License
This template was developed by Peter Kedron and Joseph Holler with funding support from HEGS-2049837. This template is an adaptation of the ReScience Article Template Developed by N.P Rougier, released under a GPL version 3 license and available here: https://github.com/ReScience/template. Copyright © Nicolas Rougier and coauthors. It also draws inspiration from the pre-registration protocol of the Open Science Framework and the replication studies of Camerer et al. (2016, 2018). See https://osf.io/pfdyw/ and https://osf.io/bzm54/
Camerer, C. F., A. Dreber, E. Forsell, T.-H. Ho, J. Huber, M. Johannesson, M. Kirchler, J. Almenberg, A. Altmejd, T. Chan, E. Heikensten, F. Holzmeister, T. Imai, S. Isaksson, G. Nave, T. Pfeiffer, M. Razen, and H. Wu. 2016. Evaluating replicability of laboratory experiments in economics. Science 351 (6280):1433–1436. https://www.sciencemag.org/lookup/doi/10.1126/science.aaf0918.
Camerer, C. F., A. Dreber, F. Holzmeister, T.-H. Ho, J. Huber, M. Johannesson, M. Kirchler, G. Nave, B. A. Nosek, T. Pfeiffer, A. Altmejd, N. Buttrick, T. Chan, Y. Chen, E. Forsell, A. Gampa, E. Heikensten, L. Hummer, T. Imai, S. Isaksson, D. Manfredi, J. Rose, E.-J. Wagenmakers, and H. Wu. 2018. Evaluating the replicability of social science experiments in Nature and Science between 2010 and 2015. Nature Human Behaviour 2 (9):637–644. http://www.nature.com/articles/s41562-018-0399-z.