Emma Clinton's Portfolio
Collection of Open Source GIScience Projects
Project maintained by emmaclinton Hosted on GitHub Pages — Theme by mattgraham
RP-Spatial accessibility of COVID-19 healthcare resources
Original study by Kang, J. Y., A. Michels, F. Lyu, Shaohua Wang, N. Agbodo, V. L. Freeman, and Shaowen Wang. 2020. Rapidly measuring spatial accessibility of COVID-19 healthcare resources: a case study of Illinois, USA. International Journal of Health Geographics 19 (1):1–17. DOI:10.1186/s12942-020-00229-x.
Replication Author: Emma Clinton
Replication Materials Available at: emmaclinton.github.io
Created: 19 May 2021
Revised: 24 May 2021
Original Study Information
This analysis is a reproduction of Kang et al. (2020). This study looks at the cyberinfrastructure and analysis behind the Where COVID 19 Dashboard for the state of Illinois. This dashboard is meant to be a tool to rapidly measure the accessibility of healthcare resources (ICU beds and ventilators) in order to understand how prepared healthcare systems are to save lives during crises like the COVID-19 pandemic and to inform where future services should potentially be allocated.
This paper found that ICU beds and ventilators are not evenly distributed throughout the state of Illinois, and that people living in central and northern Chicago were better able to access healthcare services than the population living in southern Chicago. There was no significant difference between at-risk populations’ access to beds and ventilators and COVID-19 patients’ access to those same services.
Reproduction of this analysis is important for verification of the results of the original study, which have very important implications in terms of health care provision in the context of emergency situations like the evolving COVID-19 pandemic. Replication of this study could prove highly useful for creating similar tools for other states or even at a federal level.
Materials and Procedure
The script needed to replicate the data search is included here.
The full repository for this study, including data, can be found here.
The original study by Kang et al. (2020) used hospital data from IDPH, IDPH, residential data from the United States Census Bureau, and road network data from Open Street Map to analyze the spatial accessibility of healthcare resources for residents of the state of Illinois in the context of the COVID-19 pandemic. Jupyter Notebook was used for coding and running the code in this analysis. The first step in this analysis was to use a parallel enhanced two-step floating catchment area to find all people within the catchment areas of the healthcare services. The catchments in this analysis were created from travel time along the road network.
The second step in the analysis was to calculate a service-to-population ratio within each catchment. The “service” in this model is defined as ICU beds and/or ventilators. Two ratios were calculated: a bed-to-at-risk-population ratio and a bed-to-COVID-19 patients ratio. At-risk population was defined as population over age 50. To account for distance decay, multiple zones were created to represent different travel times: 0-10 min, 10-20 min, and 20-30 min, and three weights were applied in these zones (1, 0.68, and 0.22), respectively. These zones are created from a convex hull based on network travel nodes. It must be noted that these weights are not justified in the text of the paper nor in the provided code, so it is unclear on what they are based. Accessibility was then calculated as the sum of the service-to-population ratio. This summing means that areas that fall within areas of overlap between catchments were given a higher accessibility rating.
Finally, the final accessibility results are aggregated into hexagonal grids. (Hexagons were used to minimize orientation bias from edge effects.)
Deviations from the Protocol
The original study calculated accessibility of healthcare services for both the state of Illinois and for the city of Chicago. A version of the original analysis code modified by Joseph Holler, which only calculates accessibility for the city of Chicago, was used in this reproduction.
The road network provided for us to complete this replication was confined to the limits of Chicago. The road network we used therefore did not account for use of hospitals outside of the city, regardless of their distance from Chicago. However, the original collection of hospital points was used, meaning that hospitals outside of the city limits were snapped to the nearest node in the road network, causing hospitals outside of the city to be assigned to the node of the city’s road network to which they were most closely located. This reproduction attempts to account for these errors by modifying the road network used in the study to include a 30-km buffer around the city to include roads that fall within that distance. Additionally, errors in the OSM data speed attribute made it impossible for the original code to be run. Speed limits for nodes with these hardcoded errors are therefore assigned the study’s default speed of 35 mph (the same speed as is assigned to roads with no speed data). This code correction can be attributed to Maja Cannavo.
Another alteration to the code was made regarding the weights assigned to different distance buffers for the hospitals. Kang et al. (2020) did not explain nor justify the weight values used in their analysis. Therefore, the analysis was also run with new weight values of [1.0, 0.5, and 0.1]. These weight values come from Delamater, Shortridge, and Kilcoyne (2019), who found that for a two-step floating catchment analysis, the most accurate weight values for healthcare service distance decay came from a logistic cumulative distance function, with distance decay based on distance to the nearest facility for a population.
In addition, comments were added to the notebook to elucidate the code and its outputs.
Replication Results and Discussion
The spatial analysis of hospital accessibility in Chicago yielded the results shown in Fig. 1.
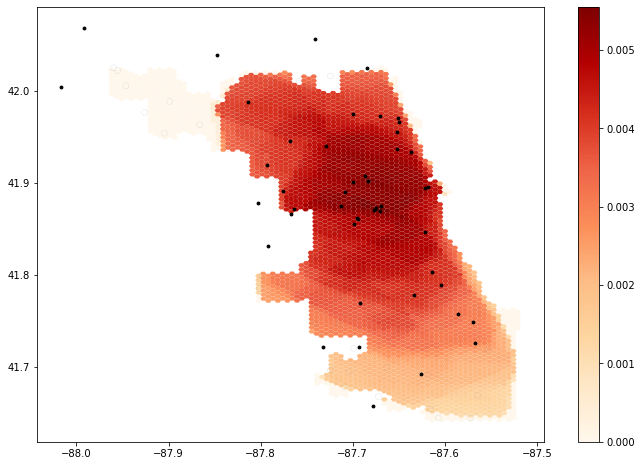
Fig. 1. Output from unaltered code.
The revised spatial analysis of hospital accessibility including the 30km buffer of the road network in Chicago yielded the results shown in Fig. 2.

Fig. 2. Output using buffered road network.
The revised spatial analysis of hospital accessibility including the 30km buffer of the road network and using the new weight values from Delamater, Shortridge, and Kilcoyne (2019) yielded the results shown in Fig. 3.
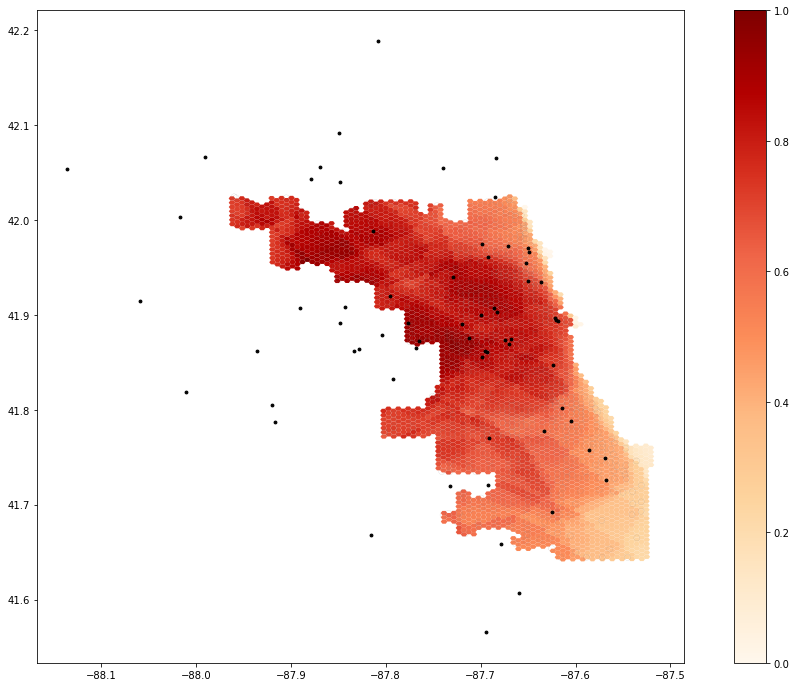
Fig. 3. Output using buffered road network with new weight values [1.0 (0-10 min), 0.5 (10-20 min), and 0.1 (20-30 min)].
From the results of Fig. 1 and Fig. 2, it appears that the use of the expanded road network led to far higher accessibility in the northwestern area of Chicago (Fig. 2) that was not accounted for in Fig. 1. The inclusion of this expanded road network therefore seems to have improved the accuracy of this map.
The result of the use of distance weights from Delamater, Shortridge, and Kilcoyne (2019) is shown in Fig. 3. When compared to Fig. 2, it appears that the lower weights of the 10-20 and 20-30 minute buffers have reduced accessibility values across the map, as indicated by the generally less-saturated colors in Fig. 3, especially in the southern and northwestern areas of the city. These weight values are clearly influencing the accessibility values across the map, meaning that decisions based on the output of this model will be influenced by the weight values used in the code. Arbitrary decisions that are introduced into a study can lead to propagation of misconceptions or uncertainty that may yield uncertain or somewhat baseless results (Longley et al., 2008). When designing a study, it is important to justify procedural decisions such as the weighting of the distance buffers in Kang et al. (2020). This justification can ensure that analyses are grounded in previous, hopefully vetted research. The use of these new healthcare distance decay weights provides some reasoning for others reproducing or replicating this study to understand the entire process of decisions that went into its design. Basing these weights on COVID-19 healthcare service utilization data would further improve this analysis.
Additionally, the implications for social justice with respect to healthcare access are important to consider here. Weighting done in this study should ultimately account for unequal access to both healthcare services and transport, especially in a city with a history of segregation like Chicago.
Other possible improvements to the code include processing of hospital data within the code, rather than beforehand, to streamline the reproduction process. Additionally, it is unclear where the “over 50” category came from in the text of the original study, although it appears to be a category in the Census data.
Conclusion
This reproduction analysis is an excellent example of how available code and data can make for research that can be reproduced in a relatively easy manner. It is fortunate that we were able to access both the data and a complete version of the code in such a user-friendly interface, and I am grateful to Kang et al. (2020) for their contributions to open-source GIScience.
In terms of reproducibility, perhaps one of the most substantial changes to the code made in this replication were the comments that were added to clarify the workings and deliverables of each block. Making code readable for all who wish to read or reproduce the methods and results of a study is empowering and allows a far wider audience to understand, utilize, question, check, or even improve on the original study. Working through this code with peers provided a valuable learning experience, and adding these comments to make the code more “readable” will make it a more valuable teaching and learning tool, as per Rey (2009). These elucidating comments explain and sometimes justify the decisions made in the code, revealing the decisions that went into the design of a study (which, as mentioned before in the context of the distance buffer weight values, are important to account for). Additionally, exploring different weight values and their justifications would benefit this model of healthcare access.
References
Delamater, P.L., A.M. Shortridge, and R.C. Kilcoyne. 2019. Using floating catchment are (FCA) metrics to predict health care utilization patterns. BMC Health Services Research 19:144. https://doi.org/10.1186/s12913-019-3969-5.
Kang, J. Y., A. Michels, F. Lyu, Shaohua Wang, N. Agbodo, V. L. Freeman, and Shaowen Wang. 2020. Rapidly measuring spatial accessibility of COVID-19 healthcare resources: a case study of Illinois, USA. International Journal of Health Geographics 19 (1):1–17. DOI:10.1186/s12942-020-00229-x.
Longley, P. A., M. F. Goodchild, D. J. Maguire, and D. W. Rhind. (2008). Geographical information systems and science 2nd ed. Chichester: Wiley. Print.
Rey, S. J. 2009. Show me the code: spatial analysis and open source. Journal of Geographical Systems 11 (2):191–207.http://dx.doi.org/10.1007/s10109-009-0086-8
Report Template References & License
This template was developed by Peter Kedron and Joseph Holler with funding support from HEGS-2049837. This template is an adaptation of the ReScience Article Template Developed by N.P Rougier, released under a GPL version 3 license and available here: https://github.com/ReScience/template. Copyright © Nicolas Rougier and coauthors. It also draws inspiration from the pre-registration protocol of the Open Science Framework and the replication studies of Camerer et al. (2016, 2018). See https://osf.io/pfdyw/ and https://osf.io/bzm54/
Camerer, C. F., A. Dreber, E. Forsell, T.-H. Ho, J. Huber, M. Johannesson, M. Kirchler, J. Almenberg, A. Altmejd, T. Chan, E. Heikensten, F. Holzmeister, T. Imai, S. Isaksson, G. Nave, T. Pfeiffer, M. Razen, and H. Wu. 2016. Evaluating replicability of laboratory experiments in economics. Science 351 (6280):1433–1436. https://www.sciencemag.org/lookup/doi/10.1126/science.aaf0918.
Camerer, C. F., A. Dreber, F. Holzmeister, T.-H. Ho, J. Huber, M. Johannesson, M. Kirchler, G. Nave, B. A. Nosek, T. Pfeiffer, A. Altmejd, N. Buttrick, T. Chan, Y. Chen, E. Forsell, A. Gampa, E. Heikensten, L. Hummer, T. Imai, S. Isaksson, D. Manfredi, J. Rose, E.-J. Wagenmakers, and H. Wu. 2018. Evaluating the replicability of social science experiments in Nature and Science between 2010 and 2015. Nature Human Behaviour 2 (9):637–644. http://www.nature.com/articles/s41562-018-0399-z.