Emma Clinton's Portfolio
Collection of Open Source GIScience Projects
Project maintained by emmaclinton Hosted on GitHub Pages — Theme by mattgraham
Gravity Model of Spatial Interaction
The purpose of this week’s lab was to create a Gravity Model of Spatial Interaction to determine the service area “catchments” of hospitals.
In the gravity model, the potential for interaction between an input and a destination is based on the attributes of the interacting features and the friction of distance between them (Rodrigue). The influences of these weight values, as well as the distance exponent, can be changed in the model. For instance, in our model, hospitals were weighted by the number of beds they have available, and towns served by hospitals are weighted by their population.
In this exercise, we analyzed the interactions between hospital clusters and towns in New England and then compared our results to those of the Dartmouth Health Atlas.
The first step in this process was to create a model to preprocess the hospitals data, which is sourced from the Department of Homeland Security. This data contains the locations of hospitals in the United States and US Territories. This model takes these hospitals and removes hospitals that lack data on number of beds, hospitals that are closed, and hospitals that are not categorized as children’s hospitals, women’s hospitals, or general acute care facilities (i.e. hospitals that do not provide a normal ICU for public care).
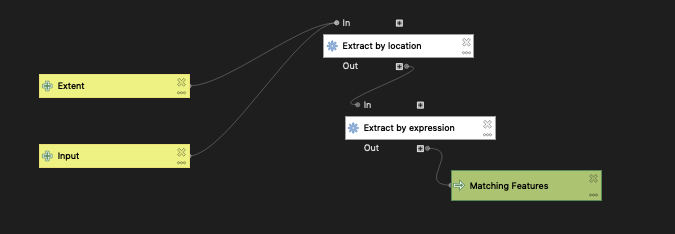
Homeland Security hospital data preprocessing model
After the HSA data was filtered, the next step was to group the hospitals by town, essentially creating a single centroid for all the hospitals that fall within each zip code. The town and population data from the American Community Survey 2018 5-year average was collected and packaged by Joe Holler. This model sums the number of beds available in the centroids and retains the ZIP code, the hospital name, and the sum of the beds in the attribute table.
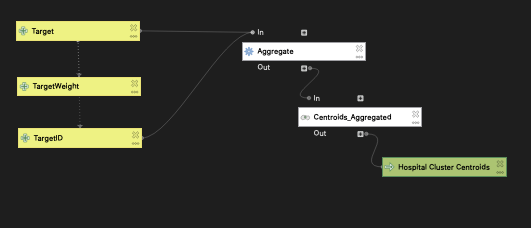
Target layer data preprocessing model
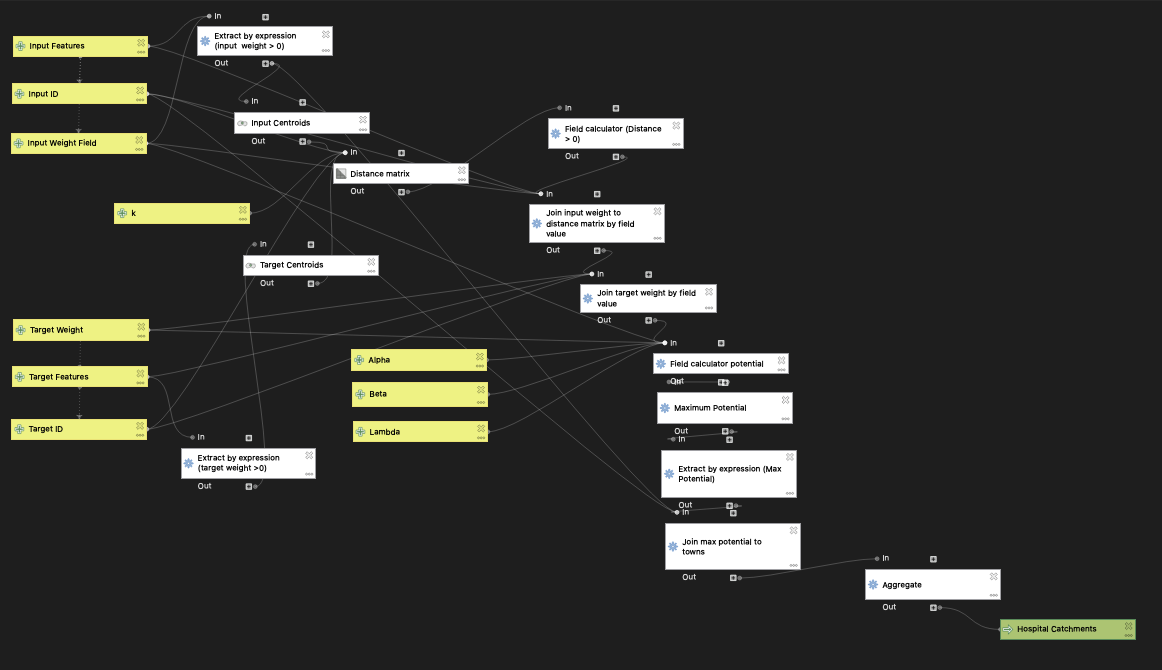
Once the data was preprocessed, the spatial interaction model could be implemented. This model takes an input layer (in our case, the towns of New England) and a destination layer (the hospital clusters created in the model above). It converts their geometries into centroids and then runs a distance matrix which calculates the distance between each of the inputs and each of the destinations. The parameter “k”, which can be adjusted, determines the number of nearest destination points that will be assessed as a possible service destination for the inputs. The default value of k is 20. The input weight values (town population) and target weight values (number of beds) are then joined as attributes to the distance matrix. The parameters used in this run of the gravity model were k = 20, λ = 1, α = 1, and β = 2. Adjustment of these parameters could potentially result in results that more closely align with those of the Dartmouth HSAs.
The potential for interaction between a source and a destination can be calculated as (inputWeight)^λ * (targetWeight)^α / (distance)^β. The potential for interaction increases as the weights of the numerator values increase, and decreases as distance increases in the denominator. Initially, input and target features with weights of 0 are excluded from the analysis using the Extract by Expression tool.
In this model, the relative influences of the weights and the distance can be altered by changing their respective exponents. The input weight’s influence can be changed via the lambda variable (default = 1), the target weight’s influence can be changed by changing alpha (default = 1) and the distance parameter can be changed by changing beta (default = 2).
After potential has been calculated for each input-target pair, the maximum potential value for each input is determined using the Field Calculator. For each input, the input-target combination with the highest potential is determined to be the most likely option for interaction.
The maximum potential data is then joined back to the input layer (in our case, towns) and this information is aggregated to form hospital service area ‘catchments’ comprised of all towns that are served by a hospital cluster target point.
Here is a link to the map comparing the model output to the Dartmouth Health Atlas Hospital Service Areas!
The results of this model differ from those of the Dartmouth Health Atlas Hospital Services Areas (HSAs). This may be due to several factors. For instance, it is possible that our k value influences our results in a way that makes them differ from the HSAs, which are based on real patient data (and therefore provide a way to ground-truth our results). It is also possible that the parameters in our potential model are weighted differently than those used when creating the Dartmouth HSAs (i.e. different exponent values for the alpha, beta, and lambda parameters). Experimenting with those values might allow us to get the results of this model to align more closely with those of the Dartmouth Health Atlas. Our exclusions of certain kinds of hospitals may have also impacted our results, as the Dartmouth Health Atlas hospital exclusions likely differed from ours.
ACKNOWLEDGEMENTS: I would like to thank Joseph Holler and the members of GEOG0323 Spring 2021 for their insights, questions, and answers regarding this project.
A useful addition to the model is the prevention of edge cases of a distance of 0 between a town centroid and a hospital to avoid any chance of a 0 in the denominator of the potential calculation. This is done using a field calculation CASE statement and the idea for this method is attributed to Maja Cannavo.
DATA SOURCES:
Population by town for Northeastern US compiled by Joseph Holler using the TidyCensus package in R (2018 American Community Survey 5-year estimates): town and population data
US hospital data courtesy of the Department of Homeland Security: https://hifld-geoplatform.opendata.arcgis.com/datasets/6ac5e325468c4cb9b905f1728d6fbf0f_0
Hospital service areas layer courtesy of the the Dartmouth Atlas of Health Care:https://atlasdata.dartmouth.edu/downloads/supplemental#boundaries