Emma Clinton's Portfolio
Collection of Open Source GIScience Projects
Project maintained by emmaclinton Hosted on GitHub Pages — Theme by mattgraham
Greenspace Access Analysis in PostGIS using Open Street Map Data
In this analysis, we attempt to use SQL queries in PostGIS to answer a simple spatial question about environmental justice in Dar es Salaam, Tanzania——a large and rapidly expanding Tanzanian city. Drew An-Pham and I collaborated on this lab. Here, we attempt to answer a simple spatial question about access to community resilience and environmental justice in this growing city: What percent of residences in each of the public administrative wards are within 0.25 km of a public greenspace?
DATA
The greenspace and residential data used in this analysis comes from OpenStreetMap, or OSM. OSM is a public mapping effort aimed at creating open spatial data. Open data free and can be used for any purpose as long as the data source and contributors are given credit (OSM). These data are collected by local parties (which can be individuals, organizations, enterprises, etc.), and the information around collection is contained in the data with a unique identifier and timestamp for each user. This information can be used to determine who was involved in the collection of the data, as the objectives of private users may differ from those of corporations or organizations. In our case, it appears that many of the main contributors to this dataset in this area are members of RamaniHuria, a community-based, Tanzanian mapping project aimed at collecting open data regarding flood risk in Dar es Salaam. The data for the wards was downloaded from RamaniHuria. Many contributors to this dataset are local university students.
OSM Data for this analysis were downloaded and provided by Joseph Holler using osm2pgsql.
METHODS
Our goals are to A) create a layer of points that are residential buildings in Dar es Salaam, B) determine how many residences are contained within each ward, C) pick out greenspaces and buffer them by our 0.25km distance of accessibility, and D) determine how many residences in each ward fall within the greenspace buffers. This will enable us to run our final calculation of percent of residences within an accessible distance of a greenspace per each ward. Although we realize that a network analysis would be a far more accurate way to determine greenspace access in a city, we use a buffer for simplicity’s sake (this is our first SQL analysis, after all!).
For this analysis, we accessed data through a PostGIS database using the Database Manager in QGIS.
The first step in this analysis is to pick out the residential buildings within the city. Here, we are defining residential buildings as any point/polygon that is not listed as an amenity and is listed as a building.
Data in OSM is organized in the form of tags, which consist of a key and a value, in the form of key=”value”. A key is used to define the type or category of the object in question, and the value is used to enumerate or elaborate on the character of the feature. An example of this key=”value” format would be natural=”wood”. The key here is natural, which specifies the type of feature as a natural feature, and the value is wood, meaning that the type of natural feature is a wood or a forest. We use these keys to pick out the residential and greenspace features we want to use in our analysis.
/* Create a table of points that are residential buildings*/

-- By default, PostGIS doesn't seem to know what type of geometry it's getting,
-- so we type-cast it with ::geometry(multipolygon,32737)  where the parameters
-- are the geometry type and SRID

CREATE TABLE respoint AS
SELECT osm_id, building, amenity, st_transform(way,32737)::geometry(point,32737) AS geom,
  osm_user, osm_uid, osm_version, osm_timestamp
FROM public.planet_osm_point
WHERE amenity IS NULL
AND building IS NOT NULL;

ALTER TABLE respoint
ADD COLUMN res real;

UPDATE respoint
SET res = 1
WHERE building = 'yes' OR building = 'residential';

DELETE FROM respoint
WHERE res IS NULL;

ALTER TABLE respoint
DROP COLUMN amenity;
We then repeat this process of picking out residences with the polygon features to ensure our analysis captures all residences.
CREATE TABLE respoly AS
SELECT osm_id, building, amenity, st_transform(way,32737)::geometry(polygon,32737) AS geom,
  osm_user, osm_uid, osm_version, osm_timestamp
FROM public.planet_osm_polygon
WHERE amenity IS NULL
AND building IS NOT NULL;

ALTER TABLE respoly
ADD COLUMN res real;

UPDATE respoly
SET res = 1
WHERE building = 'yes' OR building = 'residential';

DELETE FROM respoly
WHERE res IS NULL;
When using SQL, it’s best to simplify, simplify. Here, we convert these complex polygons to their centroids for ease of analysis, then merge these features with the points layer to create a single layer of residences.
/* Now, convert the polygons to centroids to simplify the geometries. */

CREATE TABLE respoly_centroids AS
SELECT osm_id, building, osm_user, osm_uid, osm_version, osm_timestamp,
  st_centroid(geom)::geometry(point,32737) AS geom
FROM respoly;

/* Union the points together to create one point-based table of residences*/

CREATE TABLE uni_residences AS
SELECT DISTINCT osm_id, building, st_transform(geom,32737)::geometry(point,32737) AS geom,
  osm_user, osm_uid, osm_version, osm_timestamp
FROM respoint
UNION
SELECT DISTINCT osm_id, building, st_transform(geom,32737)::geometry(point,32737) AS geom,
  osm_user, osm_uid, osm_version, osm_timestamp
FROM respoly_centroids;
Our analysis will eventually be visually represented using the wards. We therefore need to join identifying information about the wards to the residences point layer, using the spatial relationship between residential points and wards to assign a “ward_name” value to residential points.
/* Join the wards data to the uni_residences table. */

ALTER TABLE uni_residences
ADD COLUMN ward_name text;

UPDATE uni_residences
SET ward_name= ward_census.ward_name
FROM ward_census
WHERE st_intersects(uni_residences.geom, st_transform(ward_census.utmgeom,32737));
In order to determine the final percent of residences with access to greenspace, we need to calculate a total value for the number of residences per ward. This code runs that count function and groups count values by ward name.
/* Count the number of residences per ward */

/* Alter table "ward census" by adding counts of the residences contained within each ward:*/

ALTER TABLE ward_census
ADD COLUMN rescount int;

update ward_census
    set rescount = (select count(*) from uni_residences where uni_residences.ward_name = ward_census.ward_name);

/* to test a subset of the data and look at the table: */

SELECT *
FROM uni_residences
LIMIT 250;
Next, we need to define and pick out our greenspaces. We will first filter by public accessibility, and then by greenspace type, using the key=”value” format.
/* Time to consider greenspace! */

/* Filter by public accessibility */

CREATE TABLE greenspace_access AS
SELECT osm_id, access, "natural", leisure, landuse, st_transform(way,32737)::geometry(polygon,32737) as geom, osm_user, osm_uid, osm_version, osm_timestamp
FROM public.planet_osm_polygon
WHERE access = 'yes' OR access = 'permissive' OR access IS NULL;

/* Filter by type of greenspace, based on OSM key values */

ALTER TABLE greenspace_access
ADD COLUMN green_ real;

UPDATE greenspace_access
SET green_ = 1 WHERE leisure = 'common' OR leisure = 'dog_park'
OR leisure = 'garden' OR landuse = 'greenfield' OR landuse = 'grass'
OR leisure = 'nature_reserve' OR leisure = 'park' OR leisure = 'pitch'
OR landuse = 'recreation_ground' OR landuse = 'village_green' OR landuse = 'forest'
OR "natural" = 'wood' OR "natural" = 'grassland' OR landuse = 'allotments'
OR "natural" = 'shrub';

DELETE FROM greenspace_access
WHERE green_ IS NULL;
We can then buffer these greenspaces and pick out the residential points that fall within them.
/* Buffer the greenspaces by an accessible amount of distance (in our case, .25 km)*/
CREATE TABLE greenbuffer AS
SELECT osm_id, st_buffer(geom, 250)::geometry(polygon,32737) as geom from greenspace_access;

/* Intersect the points with the greenspace buffer to differentiate points that are within a buffer from those that are not */

ALTER TABLE uni_residences
ADD COLUMN green int;

UPDATE uni_residences
SET green = 1
FROM greenbuffer
WHERE st_intersects(uni_residences.geom, st_transform(greenbuffer.geom,32737));
We then repeat the process of counting points within polygons that we used above to determine the number of points in each buffer.
/* Count the number of greenspace-accessible residences per ward */

/* Alter table "ward census" by adding counts of the residences contained within each ward: */

ALTER TABLE ward_census
ADD COLUMN greenres int;

update ward_census
    set greenres = (select count(*) from uni_residences where uni_residences.ward_name = ward_census.ward_name AND uni_residences.green = 1);

    /* to test a subset of the data and look at the table: */

SELECT *
    FROM uni_residences
    LIMIT 250;
And there we have it! We can now calculate the percent of residences within 0.25km of greenspaces per ward:
/* Calculate the percentage of the residences in each ward that are within .25km of a publicly accessible greenspace */

ALTER TABLE ward_census
ADD COLUMN greenpct real;

UPDATE ward_census
SET greenpct= CAST(@greenres AS float) / CAST(@rescount AS float)*100;
RESULTS
Here is a link to a web map of our final results.
Our results show that the majority of wards with high greenspace access (and the majority of greenspaces) are located near the coast in the most well-developed and well-organized area of the city (Fig. 2). This aligns with the findings of recent studies focused on development patterns and urban sprawl in Dar es Salaam. For instance, a recent study by the Centre for Sustainable Cities found that the rates of development in Dar es Salaam are outpacing the capacity of the government to promote sustainable neighborhood development. Kombe (1994) cite the emergence of an informal land market as the main driver of the rapid development and unplanned development of land in Dar es Salaam. This has led to informal developments as the city grows outwards from its center (Bhanjee and Zhang, 2018), as seen in Fig. 1.

Fig. 1. A map of planned/unplanned development in Dar es Salaam (adapted from Bhanjee and Zhang (2018)).
It is probable that these unplanned developments involve little consideration of public greenspace access. This explains the pattern of generally decreased greenspace access and prevalence as distance from the city center increases. A more centralized form of development with greater government involvement and organized planning activity, preferably with community participation, would be highly useful to rectify the lack of greenspace access in areas away from the coastal and urban center. A recent study from the Helmholtz Centre for Environmental Research and ICLEI Local Governments for Sustainability states that
“Protecting and enhancing urban greenspaces provides huge benefits related to DSM’s growth. For example, it improves community health, reduces the city’s vulnerability to climate change, and it likely saves future costs for water supply, for sustainable livelihoods, and for a truly enjoyable city. Authorities should therefore further prioritize the maintenance and conservation of greenspace.”
To improve urban resiliency and environmental justice in Dar es Salaam, there should be a greater focus on development of accessible greenspaces.
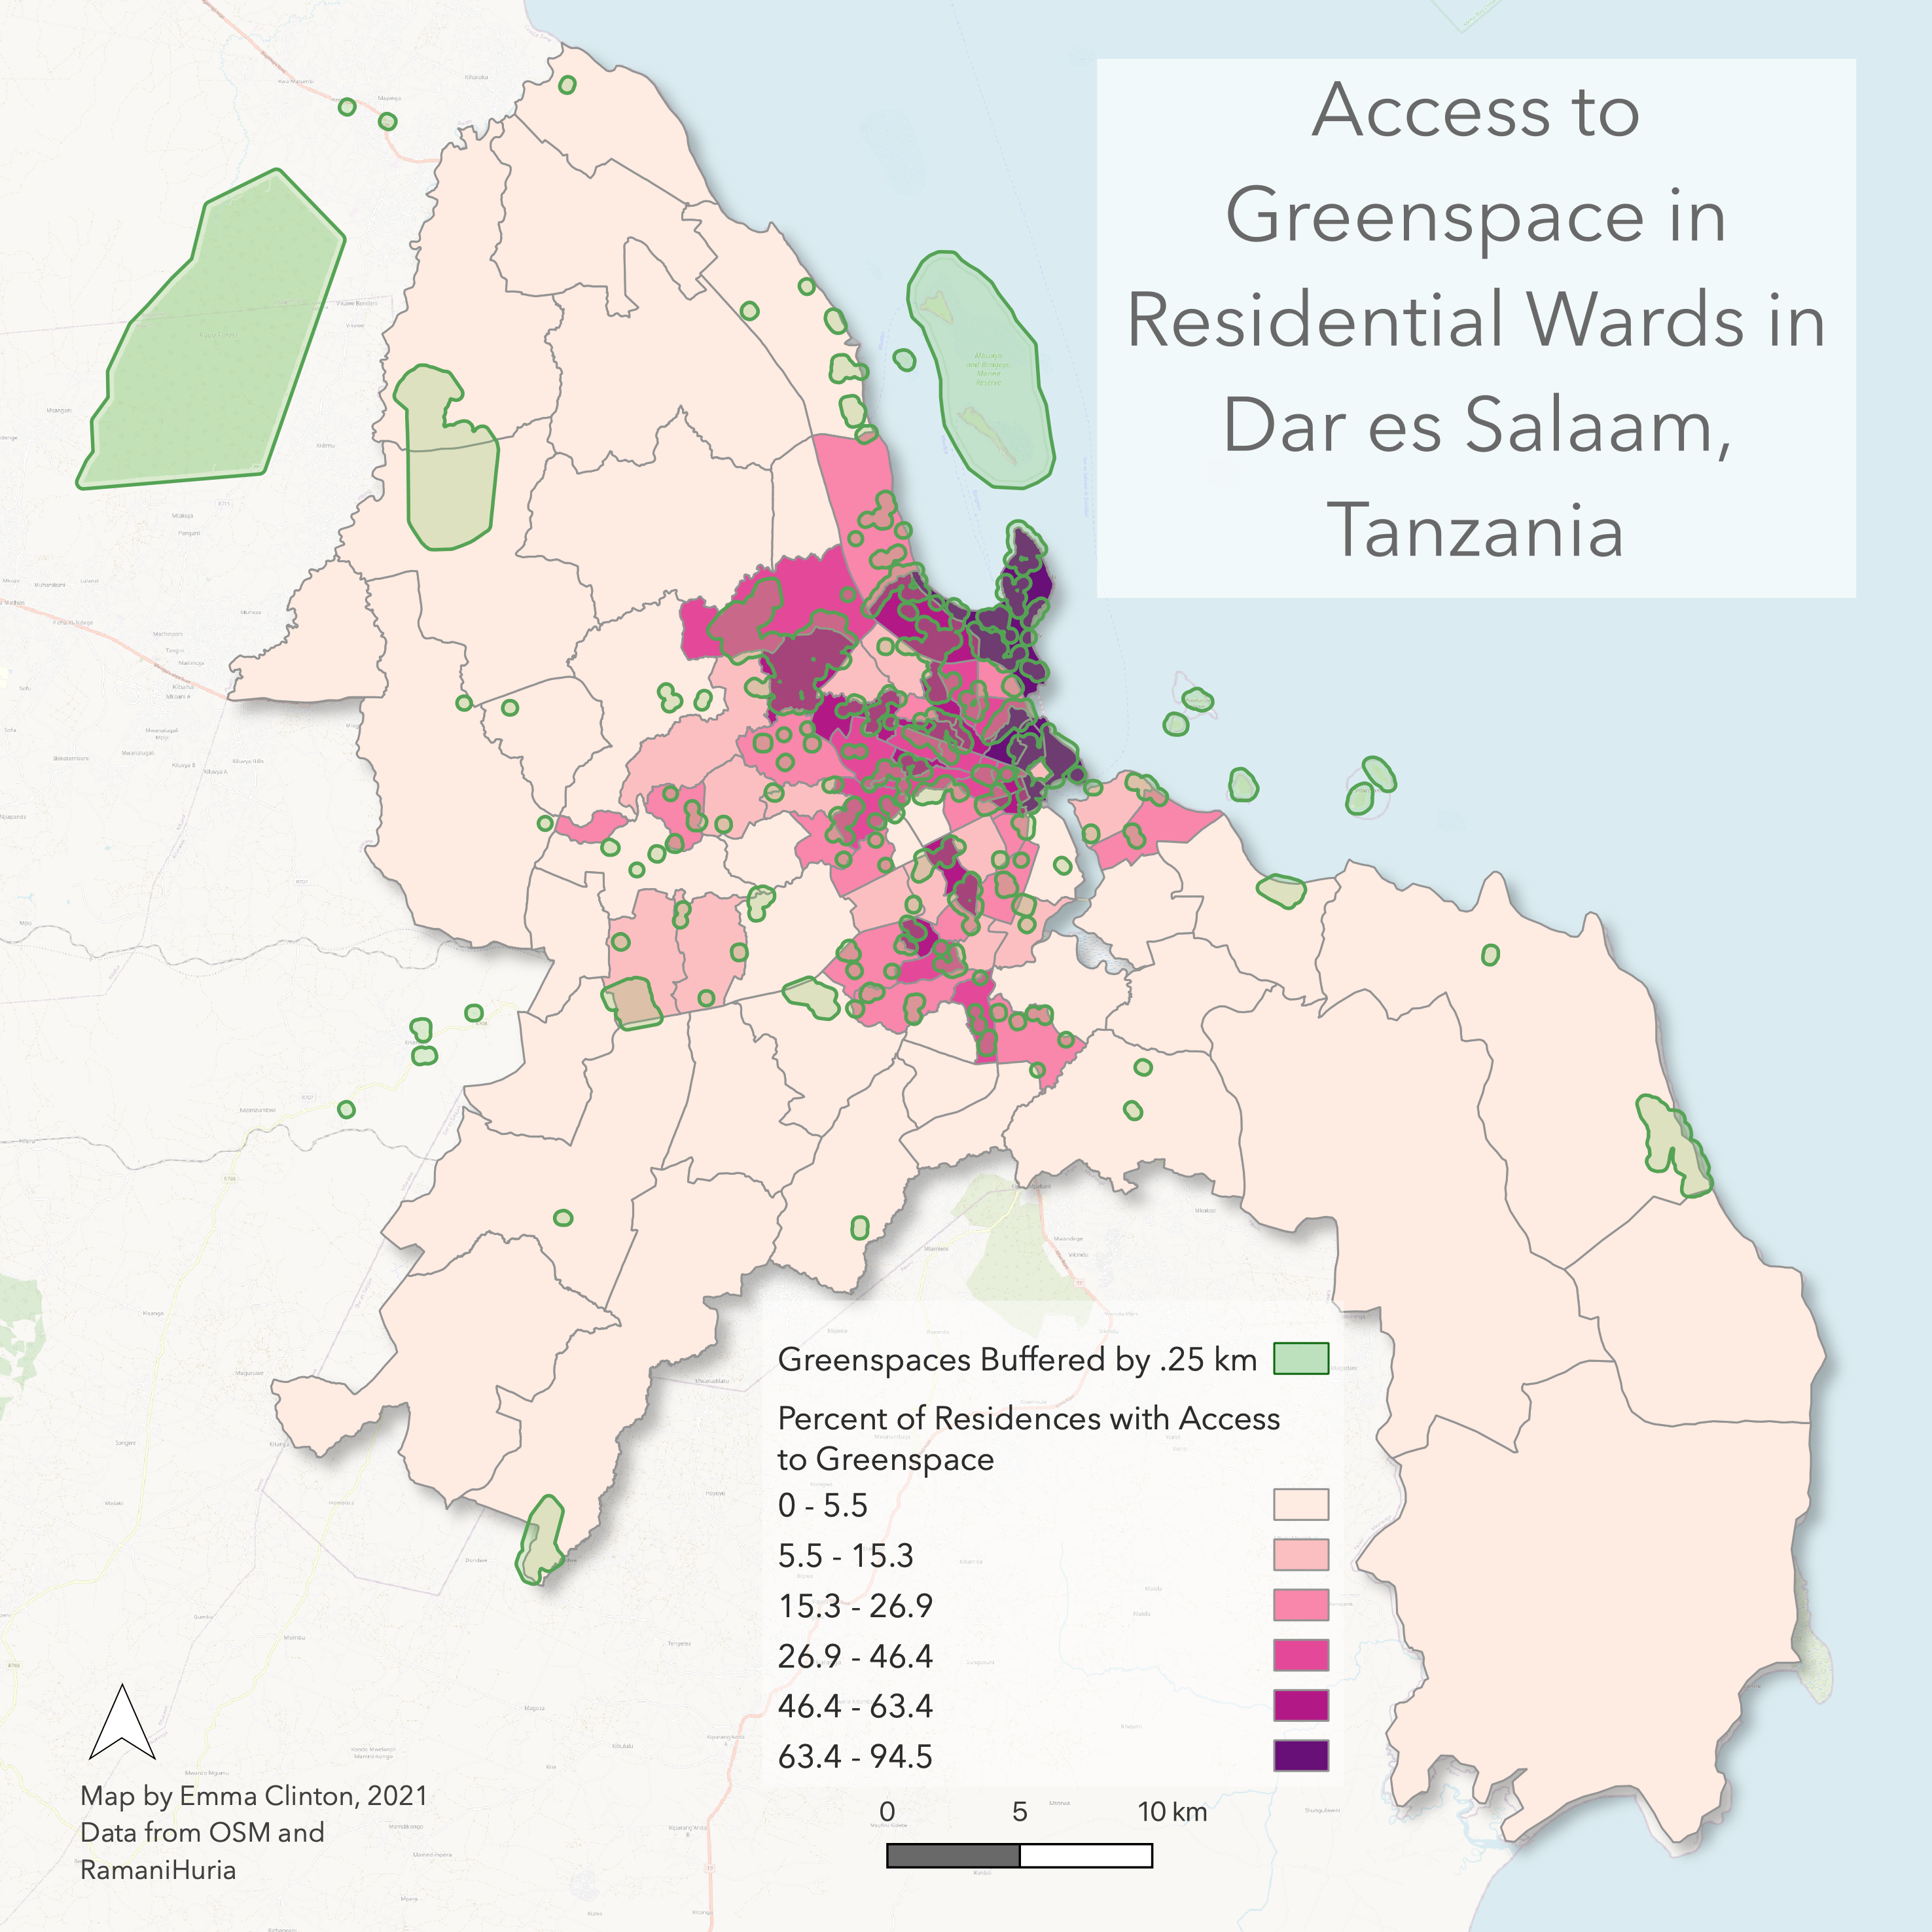 Fig. 2. A map of percent of residences within 0.25km of a greenspace in Dar es Salaam.
ACKNOWLEDGEMENTS: I would like to thank Drew An-Pham for working with me on this analysis. I would also like to thank Joe Holler for assistance with data acquisition and programming. In addition, map data in this analysis is copyrighted by OpenStreetMap contributors and available from https://www.openstreetmap.org.
DATA SOURCES:
Greenspaces and residences: OpenStreetMap contributors (2021). Retrieved from https://planet.openstreetmap.org.
Wards: RamaniHuria.
REFERENCES:
Bhanjee, S. and Zhang, C. (2018). Mapping latest patterns of urban sprawl in Dar es Salaam, Tanzania. Papers in Applied Geography, 4(2):1-13. http://dx.doi.org/10.1080/23754931.2018.1471413.
Karutz R., Berghöfer A., Moore L.R., and van Wyk, E. (2019). A Thematic Atlas of Nature’s Benefits to Dar es Salaam. Leipzig and Cape Town: Helmholtz Centre for Environmental Research and ICLEI Africa Secretariat. 78 pages. http://dcc.go.tz/storage/app/uploads/public/5db/aef/cf8/5dbaefcf875ec366483118.pdf.
Kombe, J.W.M. (1994). The demise of public urban land management and the emergence of informal land markets in Tanzania: A case of Dar-es-Salaam city. Habitat International, 18(1):23-43. https://www.sciencedirect.com/science/article/pii/019739759490037X?via%3Dihub.
Msuya, I., Moshi, I., and Levira, F. (2020). Dar es Salaam: the unplanned urban sprawl threatening neighborhood sustainability. Centre for Sustainable, Healthy and Learning Cities and Neighborhoods. http://www.centreforsustainablecities.ac.uk/research/dar-es-salaam-the-unplanned-urban-sprawl-threatening-neighbourhood-sustainability/.
And if you’d rather see the code all in one place:
/* Create a table of points that are residential buildings*/
/* Here, we are defining residential buildings as any point/polygon that is not listed as an amenity and listed as a building*/
-- By default, PostGIS doesn't seem to know what type of geometry it's getting,
-- so we type-cast it with ::geometry(multipolygon,32737)  where the parameters are the geometry type and SRID

CREATE TABLE respoint AS
SELECT osm_id, building, amenity, st_transform(way,32737)::geometry(point,32737) as geom, osm_user, osm_uid, osm_version, osm_timestamp
FROM public.planet_osm_point
WHERE amenity IS NULL
AND building IS NOT NULL;

ALTER TABLE respoint
ADD COLUMN res real;

UPDATE respoint
SET res = 1
WHERE building = 'yes' OR building = 'residential';

DELETE FROM respoint
WHERE res IS NULL;

ALTER TABLE respoint
DROP COLUMN amenity;

CREATE TABLE respoly AS
SELECT osm_id, building, amenity, st_transform(way,32737)::geometry(polygon,32737) as geom, osm_user, osm_uid, osm_version, osm_timestamp
FROM public.planet_osm_polygon
WHERE amenity IS NULL
AND building IS NOT NULL;

ALTER TABLE respoly
ADD COLUMN res real;

UPDATE respoly
SET res = 1
WHERE building = 'yes' OR building = 'residential';

DELETE FROM respoly
WHERE res IS NULL;
____________________________________________________________________________________________________________
/* Now, convert the polygons to centroids to simplify the geometries. */

CREATE TABLE respoly_centroids AS
SELECT osm_id, building, osm_user, osm_uid, osm_version, osm_timestamp, st_centroid(geom)::geometry(point,32737) as geom
FROM respoly;

/* Union the points together to create one point-based table of residences*/

CREATE TABLE uni_residences AS
SELECT DISTINCT osm_id, building, st_transform(geom,32737)::geometry(point,32737) as geom, osm_user, osm_uid, osm_version, osm_timestamp
FROM respoint
UNION
SELECT DISTINCT osm_id, building, st_transform(geom,32737)::geometry(point,32737) as geom, osm_user, osm_uid, osm_version, osm_timestamp
FROM respoly_centroids;

___________________________________________________________________________________________________________

/* Join the wards data to the uni_residences table. */

ALTER TABLE uni_residences
ADD COLUMN ward_name text;

UPDATE uni_residences
SET ward_name= ward_census.ward_name
FROM ward_census
WHERE st_intersects(uni_residences.geom, st_transform(ward_census.utmgeom,32737));

____________________________________________________________________________________________________________


/* Count the number of residences per ward */

/* Alter table "ward census" by adding counts of the residences contained within each ward:*/

ALTER TABLE ward_census
ADD COLUMN rescount int;

update ward_census
    set rescount = (select count(*) from uni_residences where uni_residences.ward_name = ward_census.ward_name);

/* to test a subset of the data and look at the table: */

SELECT *
FROM uni_residences
LIMIT 250;
____________________________________________________________________________________________________________

/* Time to consider greenspace! */

/* Filter by public accessibility */

CREATE TABLE greenspace_access AS
SELECT osm_id, access, "natural", leisure, landuse, st_transform(way,32737)::geometry(polygon,32737) as geom, osm_user, osm_uid, osm_version, osm_timestamp
FROM public.planet_osm_polygon
WHERE access = 'yes' OR access = 'permissive' OR access IS NULL;

/* Filter by type of greenspace, based on OSM key values */

ALTER TABLE greenspace_access
ADD COLUMN green_ real;

UPDATE greenspace_access
SET green_ = 1 WHERE leisure = 'common' OR leisure = 'dog_park'
OR leisure = 'garden' OR landuse = 'greenfield' OR landuse = 'grass'
OR leisure = 'nature_reserve' OR leisure = 'park' OR leisure = 'pitch'
OR landuse = 'recreation_ground' OR landuse = 'village_green' OR landuse = 'forest'
OR "natural" = 'wood' OR "natural" = 'grassland' OR landuse = 'allotments'
OR "natural" = 'shrub';

DELETE FROM greenspace_access
WHERE green_ IS NULL;

/* Buffer the greenspaces by an accessible amount of distance (in our case, .25 km)*/
CREATE TABLE greenbuffer AS
SELECT osm_id, st_buffer(geom, 250)::geometry(polygon,32737) as geom from greenspace_access;

/* Intersect the points with the greenspace buffer to differentiate points that are within a buffer from those that are not */
ALTER TABLE uni_residences
ADD COLUMN green int;

UPDATE uni_residences
SET green = 1
FROM greenbuffer
WHERE st_intersects(uni_residences.geom, st_transform(greenbuffer.geom,32737));

____________________________________________________________________________________________________________

/* Count the number of greenspace accessible residences per ward */

/* Alter table "ward census" by adding counts of the residences contained within each ward:*/

ALTER TABLE ward_census
ADD COLUMN greenres int;

update ward_census
    set greenres = (select count(*) from uni_residences where uni_residences.ward_name = ward_census.ward_name AND uni_residences.green = 1);

    /* to test a subset of the data and look at the table: */

SELECT *
    FROM uni_residences
    LIMIT 250;

____________________________________________________________________________________________________________
/* Calculate the percentage of the residences in each ward that are within .25km of a publicly accessible greenspace */

ALTER TABLE ward_census
ADD COLUMN greenpct real;

UPDATE ward_census
SET greenpct= CAST(@greenres AS float) / CAST(@rescount AS float)*100;